
Shiba Inu (SHIB) is approaching a critical point in its price structure as it consolidates within a descending triangle on the four-hour chart. As of May 28, 2025, SHIB trades slightly above $0.0000146, maintaining its position near the triangle’s support zone. This formation, now nearly two weeks in the making, is preparing for a decisive move, and when it happens, it could send SHIB flying up or tumbling down by approximately 17%.
Triangle Formation Squeezes SHIB Toward a Break
The descending triangle forming on SHIB’s chart represents a classic technical setup, typically indicating a breakout is imminent. Lower highs have continued to compress the price action, while horizontal support around $0.0000143 holds firm. The pattern reflects a growing standoff between bulls and bears, with neither side yet willing to surrender control.
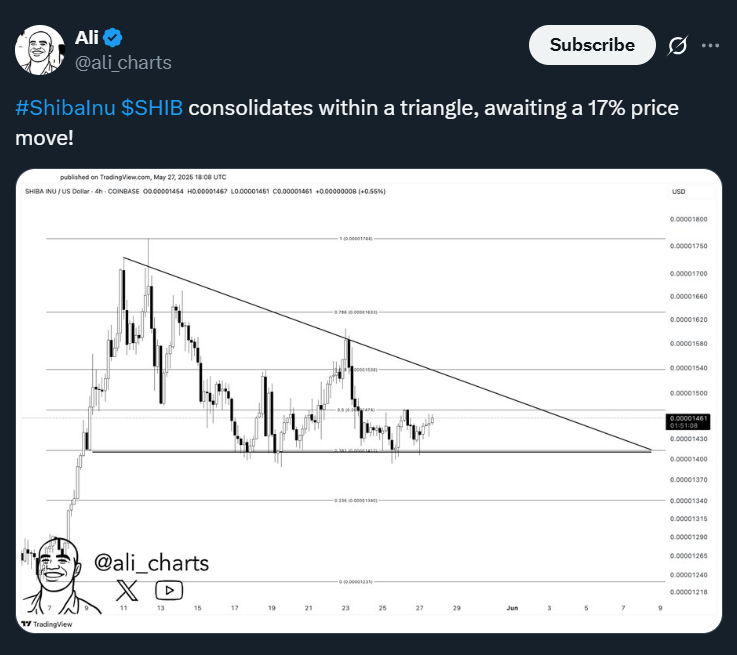
Technical analysis suggests that if SHIB breaks above the triangle’s descending trendline, a 17% upside could follow, targeting a resistance zone near $0.0000175. On the other hand, if sellers push the price below support, SHIB might fall towards $0.0000134.
Currently, SHIB trades in the middle of this narrowing range. Low trading volume has accompanied the compression, a sign that the market is waiting for a trigger, possibly a catalyst from broader market sentiment or a sudden shift in investor behavior.
May’s Recovery Brings Some Relief After Rough Start
Despite the current uncertainty, May has offered SHIB investors a reprieve. The token is up 7.8% so far this month, breaking a three-month streak of sharp declines. SHIB suffered double-digit losses in January, February, and March, making its recent stability a welcome development.
That said, SHIB’s historical performance in June paints a cautionary picture. Over the past few years, June has averaged a negative return of -15.1% for SHIB. Traders are well aware of this trend and are proceeding carefully as May winds down.
Q2 Gains Lack Momentum, but Setup Signals Change
Looking at the broader quarterly picture, SHIB has regained some ground in Q2 with a 15.3% recovery. However, the rally has failed to build strong momentum. Price action remains largely sideways, contained within the triangle formation mentioned earlier.
As the apex of the triangle draws closer and the trading range tightens further, pressure is building. If volume begins to spike and breaks the current equilibrium, the move could be sharp and directional.
Conclusion: Market Awaits SHIB’s Next Big Move
With just days left in May and the technical structure ripe for resolution, SHIB could break out at any moment. Traders should watch the $0.0000143 support and the descending resistance line for signs of confirmation. A move beyond either level could determine the token’s direction into June and beyond.
Given SHIB’s volatile nature and bearish June history, the coming days may provide critical clues for short-term strategy. The triangle pattern is set, and the countdown to a breakout has begun.