
As of February 11, 2025, Shiba Inu (SHIB) is trading at $0.00001605, facing resistance despite achieving a significant milestone. The meme coin remains under pressure, with market sentiment divided between optimism surrounding a historic UAE partnership and concerns over fading speculative interest.
Shiba Inu’s UAE Partnership: A Game-Changer for Web3 Integration
Shiba Inu has entered into a landmark partnership with the UAE government, signalling a major shift in the national adoption of Web3 technologies. Implementing Shiba Inu’s Operating System™ across all Emirates sets a precedent for blockchain integration in governance, marking a significant milestone for institutional acceptance of SHIB.
Shytoshi Kusama, the lead developer of the Shiba Inu Ecosystem, emphasized that this is more than just another crypto collaboration—he describes it as a “nationwide movement” that could influence how governments leverage decentralized technologies.
Institutional Interest and Market Sentiment
The announcement has triggered heightened discussions across social media, with SHIB-related mentions surging 22% in just 24 hours. However, whale activity has slowed despite this spike in engagement, raising concerns over whether this partnership will translate into sustained institutional investment.
- Large transactions (>$100,000) have declined by 9.8%
- Overall market engagement is showing signs of decline
- Institutional interest remains centered on long-term partnership implications rather than immediate market moves
Read also: Shiba Inu Holders on Edge as Price Fluctuates: What’s Next?
Technical Price Analysis: SHIB Faces Key Resistance
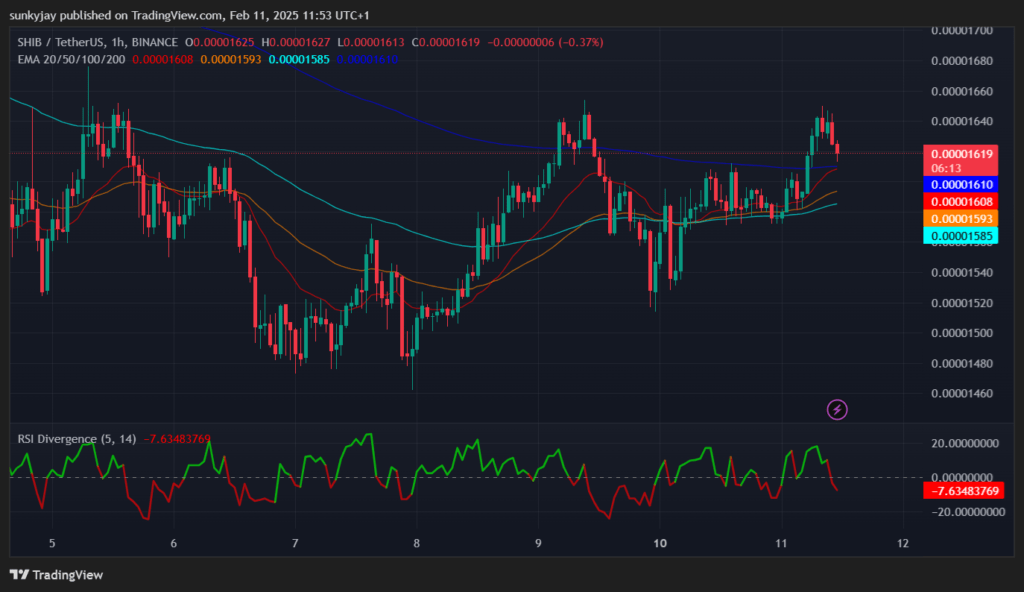
As shown in the attached image, the 1-hour SHIB/USDT chart from Binance presents mixed signals about SHIB’s near-term price trajectory.
- Key Resistance and Support Levels:
- Resistance: SHIB is currently struggling around the $0.00001620 – $0.00001640 zone, a level where selling pressure has emerged.
- Support: The $0.00001585 – $0.00001593 region, marked by the 50 EMA (Exponential Moving Average), is a crucial support level. A breakdown below this range could signal further downside.
- Moving Averages (EMA):
- The 20 EMA (short-term) is above the 50 EMA and 100 EMA, indicating that SHIB has attempted a short-term bullish move. However, the 200 EMA (blue line) remains above the price, reinforcing long-term bearish pressure.
- If SHIB fails to break above the 200 EMA, further consolidation or a minor correction is likely.
- RSI Divergence (5,14):
- The Relative Strength Index (RSI) divergence indicator flashes red (-7.63), suggesting bearish momentum is creeping in.
- This aligns with the price pullback after recent attempts to push above $0.00001640.
Outlook: Will SHIB Break Through or Pull Back?
While the UAE partnership signals long-term bullish potential, the immediate price action suggests SHIB is struggling to break out. A decisive move above $0.00001640, backed by volume, could trigger a rally toward $0.00001700. Conversely, if SHIB fails to hold $0.00001585, the next downside target would be $0.00001550.