
Fetch.ai (FET) experienced a dynamic 24-hour trading session, marked by significant volatility. The token’s price moved within a range of $1.19 to $1.26, reflecting a balance between bullish recovery attempts and bearish pullbacks. Despite fluctuations, FET managed to close near the $1.24-$1.25 mark, signaling resilience and the potential for further consolidation.
Let’s dive deeper into the 24-hour performance, key price movements, and the drivers behind FET’s latest activity.
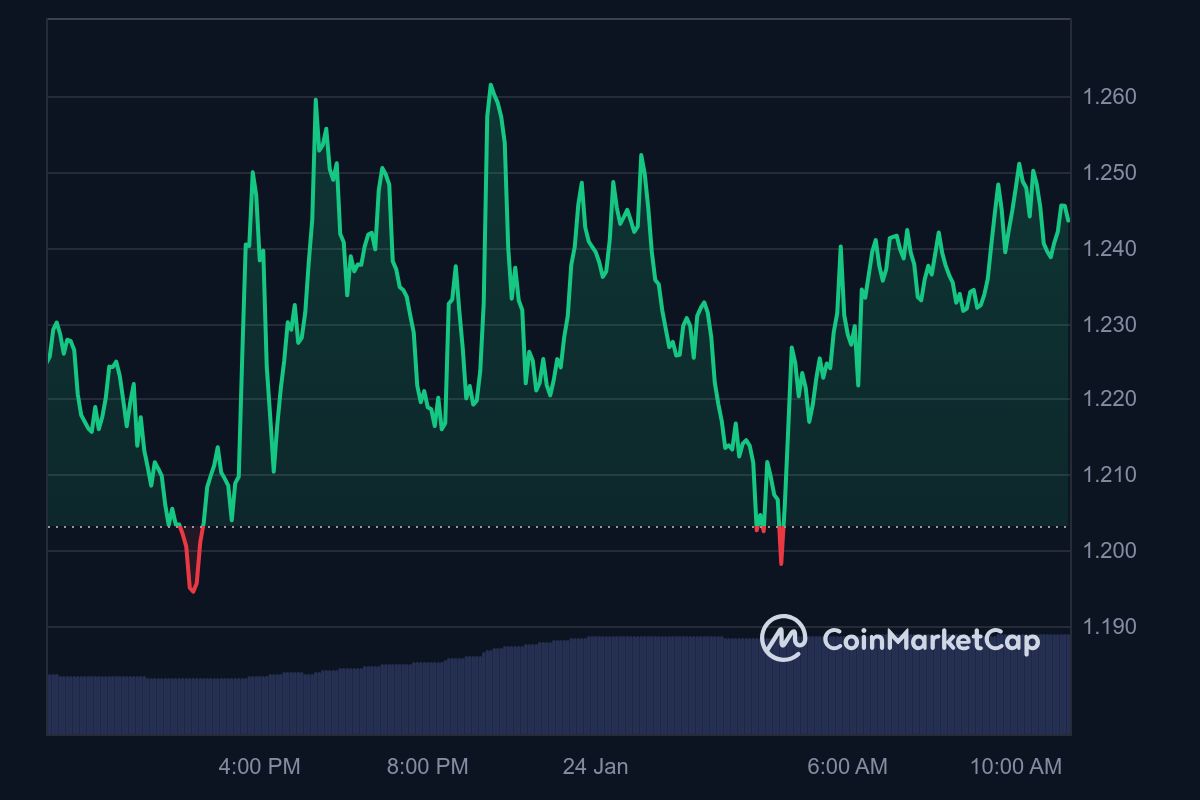
24 hours price chart- source: CoinMarketCap
24-Hour Performance Overview
Fetch.ai started the day at approximately $1.21, with early trading marked by a sharp dip to its intraday low of $1.19. However, the token quickly rebounded, supported by strong buying pressure, which pushed it toward an intraday high of $1.26. This rally was short-lived as profit-taking by traders and reduced volume brought FET back into a consolidation phase near the $1.24-$1.25 range.
Key Price Movements
- Early Trading Hours (Sharp Decline):
- Fetch.ai saw a dip during the early trading session, testing its key support level at $1.19. This downward movement likely reflected initial selling pressure as traders reacted to broader market trends.
- Midday Recovery and Peak:
- The token staged a notable recovery as buying activity increased, pushing FET to an intraday high of $1.26. This surge was fueled by renewed interest in Fetch.ai’s underlying technology and potential speculative momentum.
- Late-Session Consolidation:
- As the trading day progressed, FET entered a consolidation phase. The price hovered between $1.23 and $1.25, suggesting a balance between bullish and bearish sentiment.
Factors Influencing Fetch.ai’s 24-Hour Price Movements
- Market Sentiment:
- FET’s performance mirrored the broader cryptocurrency market’s volatility, with Bitcoin and Ethereum also experiencing swings. Positive sentiment from the AI and blockchain sectors may have partially offset bearish pressures.
- Short-Term Profit-Taking:
- The quick rally to $1.26 prompted some traders to lock in profits, contributing to the token’s retracement to lower levels.
- Trading Volume:
- While there was a brief spike in volume during the recovery phase, overall activity remained moderate. This limited FET’s ability to sustain its upward trajectory.
- Technical Trends:
- FET’s movement within the range of $1.19-$1.26 highlights its adherence to technical support and resistance levels, which influenced trader behavior throughout the session.
Technical Analysis
- Support and Resistance Levels:
- Key Support: $1.19
- Immediate Resistance: $1.26
- FET’s ability to hold above its support at $1.19 will be crucial for maintaining bullish momentum. Conversely, breaking through $1.26 could signal a stronger upward trend.
- Moving Averages:
- The token’s price remains near its short-term moving average, indicating a period of indecision in the market. A decisive move above this level could signal bullish intent.
- Relative Strength Index (RSI):
- The RSI indicates that FET is trading in neutral territory, suggesting room for both upward and downward movement depending on market catalysts.
Outlook for the Next 24 Hours
Fetch.ai’s near-term performance will depend on its ability to break through key resistance levels while maintaining support. Traders should closely watch for shifts in volume and broader market trends, as these will likely dictate the token’s trajectory.
- Bullish Scenario:
- A breakout above $1.26 could lead to a test of the next resistance zone at $1.30, provided buying momentum increases.
- Bearish Scenario:
- A failure to hold above $1.20 might result in a retest of the $1.15-$1.19 support range, especially if market sentiment turns negative.
Conclusion
Fetch.ai’s 24-hour price action showcased the token’s resilience amid volatility, with price movements reflecting both trader activity and broader market influences. While the recovery from its intraday low is encouraging, the token’s struggle to maintain gains above $1.26 highlights the need for stronger bullish momentum.
Related Article: 7-Day Price Analysis: Is Neurashi (NEI) Set for…
As the market looks ahead, FET’s ability to navigate key support and resistance levels will determine its short-term direction. For now, traders should remain vigilant and ready to capitalize on clear signals of a breakout or breakdown